This post walks through the current and future scope of a sensor monitoring platform I am building. The motivation to build this platform was to produce a creative and useful gift for my wonderful partner on Valentine’s Day. This writeup will cover my decisions for each part of the system, and some general snippets that would be useful for someone interested in building something similar.
Architecture Overview
The layout for the system is as follows:
            __          ____________________                  _____________________
       ___/   \         |                  |                 |                     |
    __/       / _(x2)___| AVANI Gardening  |                 | Machine running     |
 __/         /||        |       uHAT       |                 | Dashboard Software  |
/            |||        |__________________|                 |________^___________ |
================        | | | | | | | | | |                           |
\    Plant     /        | | | | GPIO| | | |                       _.-----._
 \   with     /         ____________________                    .-    DB   -.
  \__Sensor__/          |                  |                    |-_       _-|
                        | SBC reading data |---- Network -----> |  ~-----~  |
                        |    from uHAT     |      Layer         |-_       _-|
                        |__________________|                    |  ~-----~  |
                                                                `._       _.'
                                                                   "-----"
Data flows through the system in the following manner:
- Soil moisture sensors measure the electric capacitance of the soil, which is supposed to be a proxy for water content in the soil, and then the sensor emits a voltage.
- Analog voltage values are read by an analog-to-digital converter (ADC) on the Avani Gardening uHAT, which converts the sensor voltage into a 10-bit unsigned integer.
- The ADC is sampled by software on the single board computer (SBC) and sent over the network layer along with a sensor identifier and an ISO 8601 timestamp in UTC.
- On the other end, there is another computer receiving the data over the network, and storing it in a database.
- Lastly, A data visualization web app connects to the database to read the data and present it in a nice UI for the user.
This architecture was designed with a focus on ease of maintainance and extensibility, in that order. This is a hobby project which is intended to be something I iterate on in my free time, which is in scarce supply. If something breaks, I want a quick and easy troubleshooting experience, especially because hardware is involved. It is likely in the future I will want to add more sensors, so setting up a database where I can dump readings which can be easily mapped back to the source sensor which produced the reading is essential. More sensors means more devices, so decoupling data collection from visualization is worthwhile since it make adding new sensors to the system quite easy.
Throughout the rest of the article, I’ll be walking through the implementation of this system and all of the smaller decisions I made a long the way
Soil Sensor, and other hardware purchases
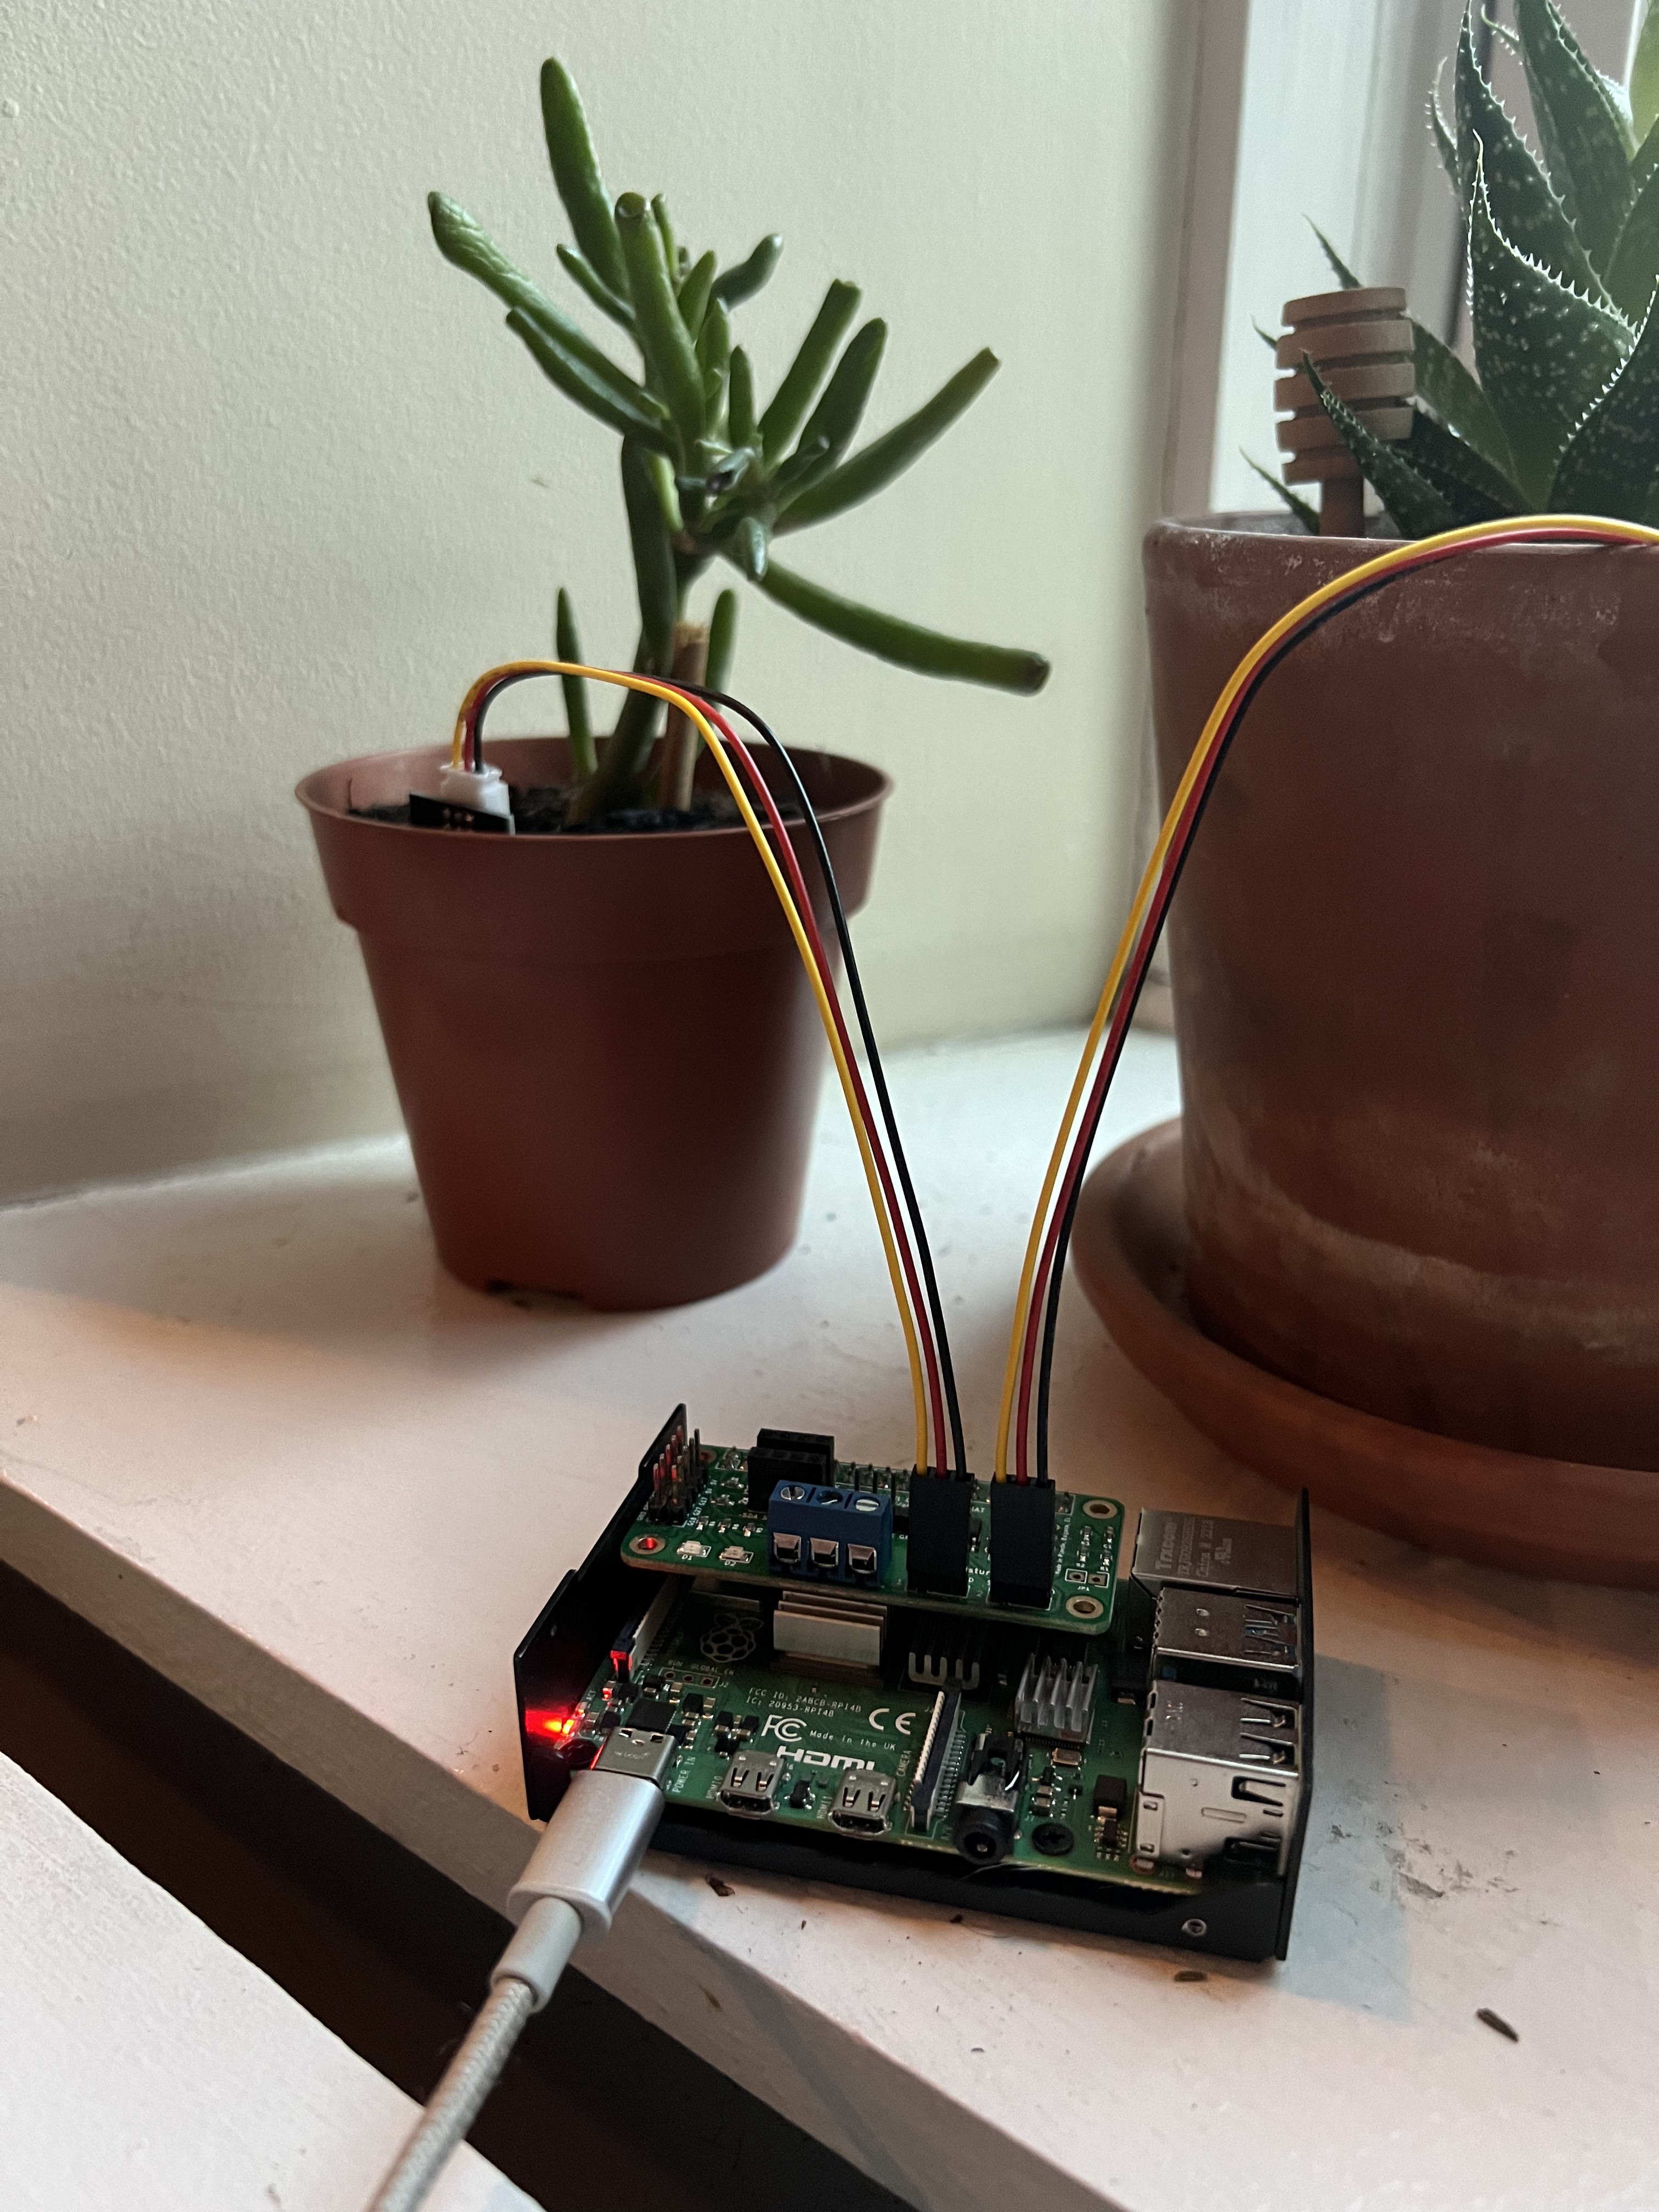
I went with the Gardening uHat Developer Kit from AVANI because it seemed like a good starting point for a not-so-beginner programmer who is very much a beginner when it comes to playing with sensors. It appears the flow is pretty simple:
- The sensor recieves a 5v charge
- Current flows through the sensor, which is stuck into the plant soil. As current flows through the sensor, it passes through a little sample of the soil, measuring it’s resistance to conduction. This is a proxy for measuring moisture.
- The uHAT samples the voltage level reported back over the wire connecting the uHAT to the sensor.
- The uHAT then reports the voltage level as a quantized 10-bit unsigned integer over the Raspberry Pi’s GPIO pins, communicating via I2C.
The uHAT has much more functionality than what I’ve just described, but the goal is to build something quickly, and this is enough for us to get a good start. AVANI, the creators of the the hardware, kindly provided us with a Python script that shows us the basics of how to read the moisture sensors:
def get_adc(channel):

   # Make sure ADC channel is 0 or 1
   if channel != 0:
       channel = 1

   # Construct SPI message
   #  First bit (Start): Logic high (1)
   #  Second bit (SGL/DIFF): 1 to select single mode
   #  Third bit (ODD/SIGN): Select channel (0 or 1)
   #  Fourth bit (MSFB): 0 for LSB first
   #  Next 12 bits: 0 (don't care)
   msg = 0b11
   msg = ((msg << 1) + channel) << 5
   msg = [msg, 0b00000000]
   reply = spi.xfer2(msg)

   # Construct single integer out of the reply (2 bytes)
   adc = 0
   for n in reply:
       adc = (adc << 8) + n

   # Last bit (0) is not part of ADC value, shift to remove it
   adc = adc >> 1

   # Calculate voltage form ADC value
   # considering the soil moisture sensor is working at 5V
   voltage = (5 * adc) / 1024

   return voltage
The Full example is here. Running the example on my RPi got some readings onto the terminal output.
Notes
- Some people have observed that the quality on some of these sensors is hit or miss. Source. I don’t think there’s much I can do now that I’ve bought the equipment, but it seems like it’s worthwhile to test your sensors once you’ve bought them.
- Now that I’ve deployed this system to prod, it seems that my Raspberry Pi 4 runs into a good amount of hard faults that require a reboot. I’ve heard of similar stories related to the failure rate of microSD cards and power delivery. More research needed.
Sensor Data Management
With sensor readings showing up on the terminal, the next step is to get those readings into some data store that could be read by the web app. Here’s the basic list of requirements for the system that manages my sensor data:
- It needs to support concurrent writes and non-blocking reads
- It needs to be simple to set up
- It needs to be trivial to communicate writes over the network layer to this DB
There’s a pretty simple list of requirements. After some consideration, I decided to go with a SQLite database wrapped in a FastAPI frontend that allows for sensors to POST their data and then retrieve that same data through other means. The motives for choosing these technologies are as follows:
- I’ve used them before and understand how they work, making it easier to troubleshoot and deploy quickly.
- They aren’t necessarily the best for this job, but the overhead is acceptable, given that the scale at which we’re operating is quite small.
- Adding more publishers to this data store is as simple as cloning my sensor collection repo and bringing it up on a new Raspberry Pi.
- It still makes it dead simple to swap out other technologies at other layers of the stack should I choose to do so.
Here’s the entire code for my data collation:
from fastapi import FastAPI
from fastapi.responses import HTMLResponse
from typing import Dict

from datetime import datetime

import sqlite3

app = FastAPI()


@app.post("/upload")
async def receive_data(payload: Dict):
    # Step  1: Obtain the JSON payload as a dictionary
    readings = payload.get("readings", [])
    timestamps = payload.get("timestamps", [])
    sensor_id = payload.get("sensor_id", "")

    # Step  2: Open a connection to the SQLite database
    conn = sqlite3.connect("planthub.sqlite")
    cursor = conn.cursor()

    # Step  3: Check if there's a table present with a name matching the "sensor_id" field
    cursor.execute(
        "SELECT name FROM sqlite_master WHERE type='table' AND name=?", (sensor_id,)
    )
    table_exists = cursor.fetchone() is not None

    if not table_exists:
        # Create the table if it doesn't exist
        cursor.execute(
            f"""
            CREATE TABLE {sensor_id} (
                id INTEGER PRIMARY KEY AUTOINCREMENT,
                readings INTEGER NOT NULL,
                timestamps TEXT NOT NULL
            )
        """
        )
        conn.commit()

    # Step  4: Insert the readings and timestamps into the table
    for i in range(len(timestamps)):
        cursor.execute(
            f"INSERT INTO {sensor_id} (readings, timestamps) VALUES (?, ?)",
            (readings[i], timestamps[i]),
        )

    # Commit the changes and close the connection
    conn.commit()
    conn.close()
I could’ve chosen to write a handle for a GET request for the same data, but since I’m using Python so heavily, I instead settled on just making my Dashboarding app run on the same machine as the data store and then load the SQLite DB from the filesystem. It’s simple, yet quite effective.
Notes
- Phind was a godsend when it comes
to writing tests and debugging limited-scope applications such as this. Some
notable examples of ways that Phind saved me time, overall finding that Phind is
capable of replacing questions that would typically need 5-10 Google searches,
while I still default to search engines when I think the amount of queries I’d
need to accomplish the task would be <5, or I was confident that I’d be capable of just copy-pasting the code:
- Given a FastAPI web app, write some
tests I can run from the shell using
curl. - “Tutorial on setting up a Python script as a daemon that boots at startup using systemd”
- “Given this table schema, write SQL Queries for writing and reading from this table while abiding the following set of constraints: … "
- Given a FastAPI web app, write some
tests I can run from the shell using
Dashboarding
I chose to use Plotly’s Dash to build a simple dashboard for this data. If you didn’t glean the structure of the database from the uploading code, here’s a quick explainer:
- POST requests sent to the data store have three components,
id,timestamps, andreadings- The
idis formatted as[$MACHINE_HOSTNAME]_[$SENSOR_CHANNEL] - The
readingsis a JSON array of unsigned integers, corresponding to values read from the sensor - The
timestampsis a parallel JSON array of ISO 8601 Timestamps, which corresponds to the time (in UTC) when that reading was retrieved from the sensor.
- The
- If there is no table in the SQLite DB that matches the
id, a new one is created. - Readings are appended to the table, along with an auto-incrementing index.
The “a minimal Dash App” tutorial Link is a great starting point. There were only two major changes I made that meaningfully change from this example:
-
I noticed that by default, visualizing the entire dataset was creating large amounts of network traffic which was melting both the client and the server. I instead made it so at most, the past 24 hours are visualized, and even then I only really report a subset of that data.
-
I created a hourly moving average of the readings since the data appears to be quite noisy. Thankfully, that’s quite easy to do with Pandas.
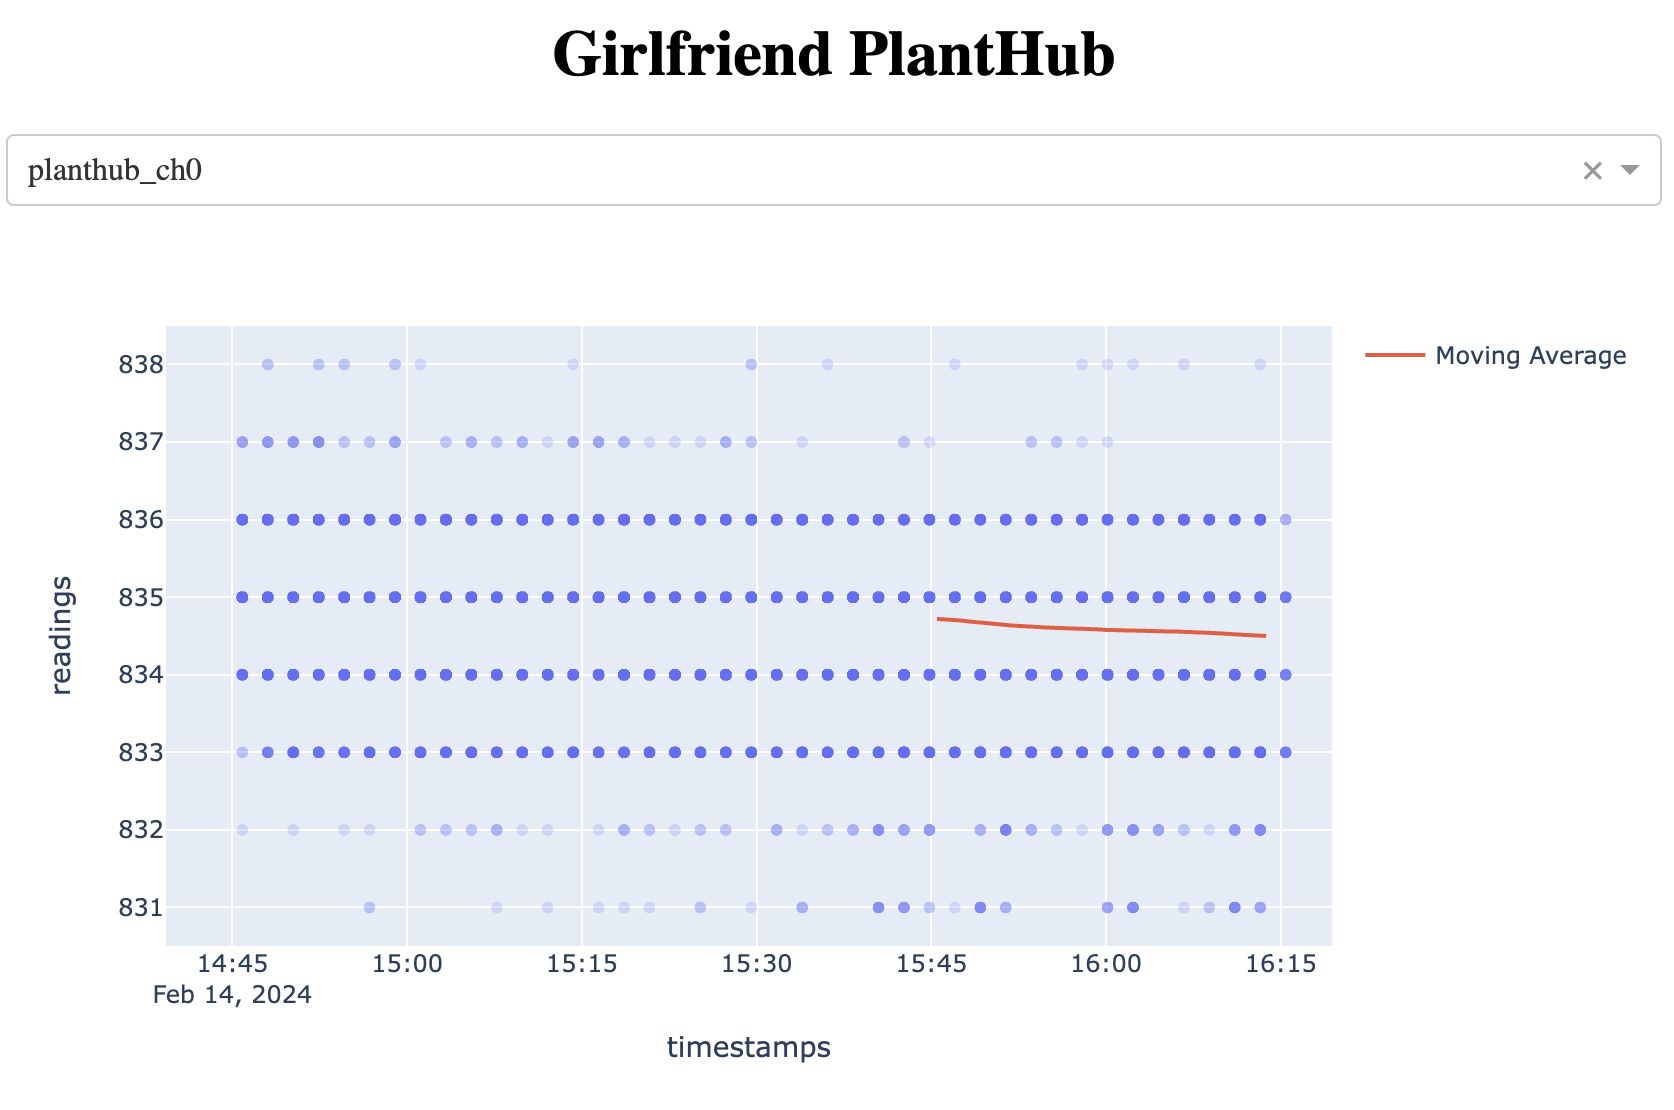 Pro Tip: If you have lots of overlapping data on a point plot, you can set the
alpha value really low and it becomes a heat map
Pro Tip: If you have lots of overlapping data on a point plot, you can set the
alpha value really low and it becomes a heat map
Next Steps
The ideal goal is get to a point where I can have my platform send users notifications to encourage better watering practices. Thankfully, my target audience already does a great job of taking care of her plants, so collecting a journal of plant watering times that works well for the plants should be quite straightforward.